
When you’re trying to run large-scale performance tests, tools like BlazeMeter and JMeter can make your life much easier. BlazeMeter is a cloud-based platform that helps you run, manage, and analyze load tests. JMeter is an open-source tool for creating and running those tests. But sometimes, you hit a wall: you record a test scenario in BlazeMeter, and the JMX file (the script file JMeter uses) doesn’t get recorded or downloaded as you expect.
If you’re reading this, you probably know the frustration. You spend time setting up your test, maybe using the BlazeMeter Chrome extension, but your JMX file is missing. You’re not alone—many QA engineers and developers struggle with this. This article explains why BlazeMeter might not record your JMX, how to fix it, and what you should check before trying again.
You’ll also learn best practices, troubleshooting steps, and some expert tips that can save you hours of effort.
Understanding Blazemeter And Jmx
Before diving into the problem, it’s important to understand what BlazeMeter and JMX files are and how they work together.
BlazeMeter is a cloud-based service that lets you run JMeter scripts at scale. You can record user actions (like clicking links or filling forms) and export them as JMX files. These files are XML-based and describe the test plan for JMeter.
A JMX file is the backbone of any JMeter test. It contains all the test elements—thread groups, samplers, controllers, listeners, and more. BlazeMeter gives you tools to record these actions and export them as JMX files, which you can then edit or run directly in JMeter.
But when BlazeMeter fails to generate or let you download the JMX, your testing workflow stops. Let’s explore why this happens.
Common Reasons Blazemeter Fails To Record Jmx
Several factors can cause BlazeMeter not to record or generate a JMX file. Understanding these will help you troubleshoot faster.
1. Blazemeter Chrome Extension Not Working Properly
The most common way to record user actions is using the BlazeMeter Chrome extension. If the extension is out-of-date, disabled, or has permission issues, it may not capture traffic, resulting in no JMX file.
2. Browser Not Capturing Https Traffic
Many modern web applications use HTTPS. If the extension or proxy fails to capture encrypted traffic, the recording might be incomplete or missing, leading to a failed JMX export.
3. Network Or Firewall Restrictions
Corporate firewalls or VPNs may block the extension’s communication with BlazeMeter servers, causing the recording process to break down silently.
4. Incorrect Recording Settings
Using the wrong recording mode (like not enabling ‘Record HTTPS’) or not starting the recording session correctly can prevent BlazeMeter from capturing data.
5. Too Large Or Complex Test Sessions
If you record a session with too many requests or long durations, the extension or server might timeout, causing the JMX file generation to fail.
6. Browser Compatibility Issues
Sometimes, updates in Chrome or the extension itself can introduce bugs or incompatibilities that break the recording process.
7. Session Not Saved Or Uploaded
If you close the browser or extension before saving/uploading, the JMX file is not created.
8. Server-side Issues On Blazemeter
On rare occasions, BlazeMeter’s backend may be down or experiencing issues, blocking JMX export.
It helps to identify which of these might be affecting your situation. Let’s look at each in detail, with practical solutions.
Step-by-step Troubleshooting Guide
You can often solve the BlazeMeter not recording JMX issue by following a systematic approach. Here’s what you should do:
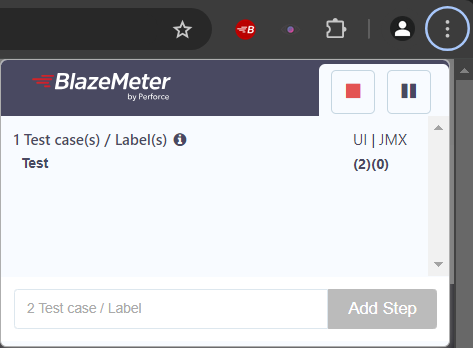
1. Check The Blazemeter Chrome Extension
- Make sure the extension is installed and enabled.
- Update the extension to the latest version.
- Restart Chrome after updating.
- Check permissions: The extension should have access to all sites.
- Try disabling other extensions that might interfere (like ad blockers or privacy tools).
2. Test With A Simple Http Site
Many issues are related to HTTPS. Try recording a simple session on a non-HTTPS website (like http://example.com). If this works, your problem is likely with HTTPS configuration.
3. Enable Https Traffic Capture
If your test site uses HTTPS (which is common), you need to enable HTTPS capture:
- In the BlazeMeter extension, turn on ‘Record HTTPS’.
- For some sites, you may need to install a root certificate to allow the extension to decrypt traffic.
- Follow the instructions in the extension for installing the certificate. This is safe if you’re only using it for testing.
4. Check Network And Firewall Settings
- If you’re on a corporate network, ask your IT team if the extension’s traffic is being blocked.
- Try recording from a different network or your home connection to rule out firewall issues.
- Disable VPNs or proxies temporarily to see if they cause problems.
5. Keep Test Sessions Short And Focused
BlazeMeter works best with short, focused recordings. If you try to record a 30-minute session with hundreds of requests, you’ll likely hit limits:
- Record only the necessary actions.
- Split complex scenarios into smaller recordings.
- After each recording, download the JMX and test it in JMeter.
6. Save And Upload Session Properly
- Always wait for the recording to finish.
- Click ‘Save’ or ‘Upload’ before closing the extension.
- Double-check that the session appears in your BlazeMeter dashboard.
7. Download The Jmx Correctly
Sometimes, users get confused about how to download the JMX:
- After uploading, go to the BlazeMeter web dashboard.
- Find your recorded session.
- Click ‘Export as JMX’ or the download button.
- If the download doesn’t start, try a different browser or clear your cache.
8. Try Another Browser Or Reinstall Extension
- If nothing works, try recording in another Chrome profile or a different browser (if supported).
- Uninstall and reinstall the BlazeMeter extension.
9. Check For Blazemeter Outages
Rarely, the problem is on BlazeMeter’s side:
- Visit BlazeMeter Status Page to check for outages.
- Wait and try again if there’s a reported problem.
10. Check Jmeter Version Compatibility
Sometimes, the JMX file is created, but JMeter cannot open it due to version issues:
- Make sure you’re using a JMeter version compatible with BlazeMeter’s exported JMX format.
- If you see errors opening the JMX, try with a newer JMeter version.
Advanced Troubleshooting And Non-obvious Insights
Beyond basic troubleshooting, there are several less-obvious details that can block JMX recording. Here are two that many beginners miss:
Recording Websocket Or Non-http Traffic
BlazeMeter Chrome extension primarily records HTTP and HTTPS traffic. Modern web apps often use WebSockets for live updates (like chat or notifications). These are not captured by the extension:
- If your test scenario relies on WebSockets, you won’t see related requests in your JMX.
- As a workaround, use JMeter’s built-in WebSocket plugins and add the steps manually.
Handling Single Page Applications (spa)
Many websites today are single page applications (React, Angular, Vue, etc.). These apps use AJAX calls and dynamic content loading:
- The extension may not capture all XHR requests if the page loads data dynamically after the initial load.
- Always interact with the site as a real user would: Click through menus, trigger popups, and submit forms while recording.
- After recording, review the request list in BlazeMeter. Add missing steps manually if needed.
Credit: help.blazemeter.com
Example: Fixing A Broken Jmx Recording
Consider this scenario:
You use the BlazeMeter Chrome extension to record a login and add-to-cart flow on an e-commerce site. When you try to export the JMX file, you either get an empty file or the download fails.
Here’s how you solve it:
- Check if the extension was capturing HTTPS traffic. If not, install the root certificate.
- Shorten the recording: Just log in and add an item, then stop.
- Save and upload the session. Wait for confirmation.
- Download the JMX from the dashboard.
- Open in JMeter. If there are errors, check the file for missing elements.
- If XHR requests are missing, manually add them using JMeter’s HTTP Sampler.
Comparing Blazemeter Recording Methods
BlazeMeter offers more than one way to record traffic. The most common are the Chrome extension and the proxy method. Here’s how they compare:
| Method | Pros | Cons |
|---|---|---|
| Chrome Extension | Easy to use, no setup required, good for web apps | Limited to browser traffic, may miss non-browser requests |
| Proxy Recording | Captures all network traffic, works for mobile and desktop apps | Setup is more complex, possible SSL issues |
If one method fails, try the other.
Best Practices For Reliable Jmx Recording
To avoid problems in the future, follow these best practices:
1. Update Your Tools Regularly
Keep both BlazeMeter and JMeter updated. Extension bugs are often fixed in new releases.
2. Record Only What You Need
Avoid long, messy sessions. Focus on the specific scenario you want to test.
3. Review And Clean Up Recordings
After recording, check the request list. Remove unnecessary requests (like ads or tracking scripts).
4. Annotate Your Test Steps
Use comments in JMeter to note what each step does. This makes debugging easier later.
5. Test Jmx In Jmeter First
Before running a large test on BlazeMeter, open your JMX in JMeter. Fix any errors or missing steps.
6. Backup Your Recordings
Save downloaded JMX files in version control (like Git) so you don’t lose your work.
Common Mistakes When Recording With Blazemeter
Many users make simple errors that cause JMX recording to fail. Avoid these:
1. Not Checking Extension Status
If the extension is disabled or crashed, nothing is recorded.
2. Recording On The Wrong Tab
Only actions in the tab where recording started are captured.
3. Forgetting To Install Ssl Certificate
Without the certificate, HTTPS sites are not recorded.
4. Closing The Browser Too Soon
Always wait for the upload/confirmation before closing.
5. Assuming All Traffic Is Captured
The extension may miss background requests or WebSockets.
6. Ignoring Error Messages
BlazeMeter usually shows an error if something goes wrong. Always read alerts.
How To Use Jmeter Proxy As An Alternative
If BlazeMeter’s built-in tools don’t work, you can use JMeter’s HTTP(S) Test Script Recorder:
- Start JMeter and add the ‘HTTP(S) Test Script Recorder’ under the WorkBench.
- Set your browser’s proxy settings to point to JMeter (default: Localhost:8888).
- Start recording in JMeter, then use your browser as usual.
- Save the JMX file directly from JMeter.
This method is more technical but gives you full control and captures all traffic.
When To Contact Blazemeter Support
If you’ve tried all troubleshooting steps and still can’t record JMX, it’s time to contact BlazeMeter Support:
- Prepare logs/screenshots showing your problem.
- List the steps you took and what you already tried.
- Share your browser and extension versions.
- Support may ask for a HAR file (browser recording) to help debug.
Support can often help with server-side issues or account-specific problems.
Credit: help.blazemeter.com
Key Differences: Blazemeter Vs. Jmeter Recording
It’s helpful to know how BlazeMeter’s recording process differs from native JMeter:
| Feature | BlazeMeter Recording | JMeter Proxy Recording |
|---|---|---|
| Setup | Browser extension, simple UI | Manual proxy configuration, more steps |
| Supported Protocols | HTTP/HTTPS only | HTTP/HTTPS, WebSockets (with plugins), more flexible |
| Editing Test Plan | Basic, web-based | Advanced, full JMeter UI |
| Download JMX | Export from dashboard | Save locally |
| Best For | Quick browser-based tests | Complex, protocol-level testing |
If you need advanced features, JMeter proxy might be the better choice.
Real-world Example: Recording A Login Flow
Let’s say you want to record a user logging in to your web app. Here’s how to do it without missing the JMX:
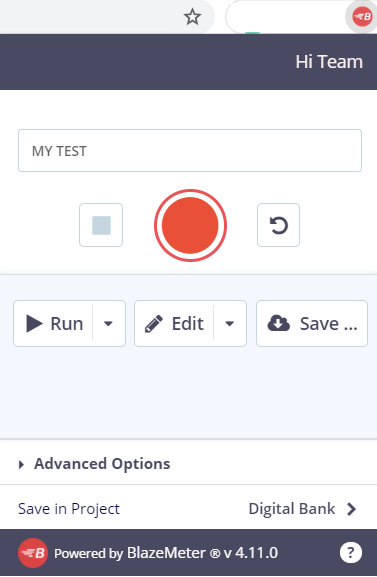
- Open Chrome and enable the BlazeMeter extension.
- Click ‘Start Recording’.
- Go to your login page and enter credentials.
- Wait for the dashboard or landing page to load fully.
- Stop the recording.
- Save and upload the session.
- Download the JMX from BlazeMeter dashboard.
- Open in JMeter and verify steps are correct.
- If login fails in JMeter, check for missing parameters (like CSRF tokens) and update the test.
Many apps use dynamic tokens. Always check that these are captured, or add them manually.
Credit: groups.google.com
Expert Tips For Reliable Blazemeter Recording
- Record in Incognito Mode: This avoids interference from other extensions or cookies.
- Clear Cookies Before Recording: Start with a clean session for accurate results.
- Use Network Throttling: Simulate slower connections to see how your app handles real-world speeds.
- Check for AJAX/XHR Calls: Expand the network log and make sure all expected requests appear in the recording.
- Document Each Test: Write down the steps and expected outcome for each recording.
Frequently Asked Questions
Why Is My Jmx File Empty After Recording With Blazemeter?
An empty JMX file usually means the extension failed to capture any HTTP/HTTPS traffic. Check if the extension was enabled, and if HTTPS traffic was allowed. Also, ensure you recorded actions in the correct browser tab.
Does Blazemeter Record Websocket Or Api Traffic?
By default, BlazeMeter’s Chrome extension captures HTTP and HTTPS requests only. For WebSocket or some API protocols, you need to use JMeter with the appropriate plugin and add those steps manually.
How Can I Fix Https Recording Issues?
Install the root SSL certificate as prompted by the BlazeMeter extension. This allows it to decrypt and capture HTTPS traffic. Make sure ‘Record HTTPS’ is enabled in settings.
What Should I Do If My Jmx File Won’t Open In Jmeter?
Check your JMeter version. Some JMX files use features from newer JMeter releases. Update JMeter and try again. Also, verify the JMX is not corrupted or empty.
Where Can I Find More Help On Blazemeter Recording Problems?
The official BlazeMeter documentation offers guides and troubleshooting steps. For advanced help, visit the BlazeMeter Support Center.
BlazeMeter is a powerful platform, but recording JMX files can sometimes be tricky. By understanding the tools, following best practices, and troubleshooting step by step, you can solve most problems quickly and get back to effective performance testing.